IoT visualization dashboard
The IoT visualization dashboard in the FOSSA IoT Hub provides an easy way to view and analyze IoT data sent from your devices through the FOSSA network.
Each Hub application has its own dedicated visualization dashboard. To access it, open your application and select the “IoT Visualization” tab at the top of the screen.
Configure your parser
To visualize your data, you must configure the parser. You can do this by clicking the gear icon in the top-right corner.
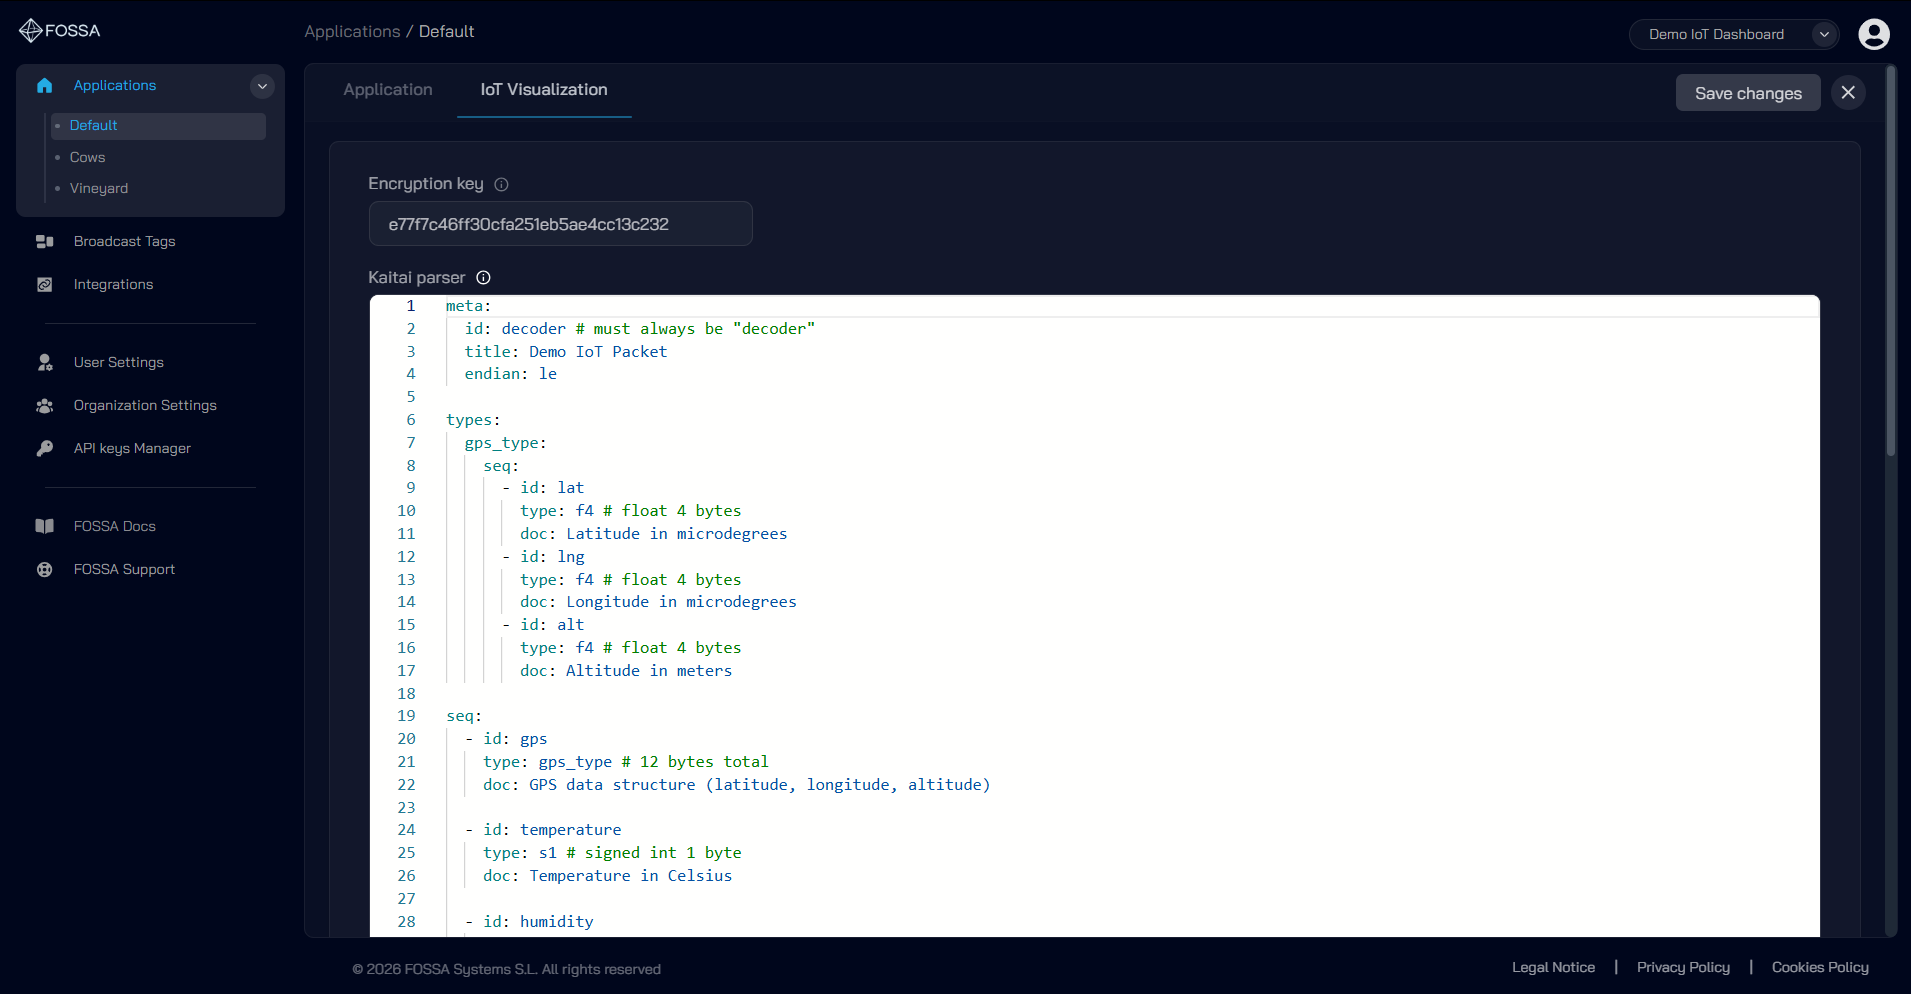
You must provide a Kaitai Struct, which defines how your data should be parsed. Optionally, you can also add an encryption key if your packets are encrypted.
To apply the changes, click the “Save changes” button.
Kaitai
The Kaitai definition describes how incoming IoT packets are decoded. It defines the exact binary structure of your IoT payloads. Each field in the Kaitai schema represents a portion of the payload. The system supports a fixed set of predefined fields:
- temperature
- humidity
- int1, int2, int3, int4 (custom integer fields)
- bool1, bool2, bool3, bool4 (custom boolean fields)
- gps (structured field containing lat, lng, alt)
You are free to include only the fields required for your IoT packets. If a field is not included in the schema, it will not be parsed or available in the visualization dashboard.
For all fields you use, the id must match exactly the supported names: temperature, humidity, int1, int2, int3, int4, bool1, bool2, bool3, bool4 and gps. If you include gps, you must also use the predefined gps_type structure with the following fields: lat, lng, alt.
Each numeric field (temperature, humidity and inta) can use any of the following types, as long as it is compatible with a python float representation: f4, s1, s2, s4, u1, u2, u4. Boolean fields must always use type: b1. GPS subfields must always be of type f4.
The order of fields in the schema determines the binary decoding order. You are free to define this order as needed.
The Kaitai structure must always have id: decoder. Any other value will not work.
Example kaitai struct:
meta:
  id: decoder # must always be "decoder"
  title: Demo IoT Packet
  endian: le

types:
  gps_type:
    seq:
      - id: lat
        type: f4 # float 4 bytes
        doc: Latitude in microdegrees
      - id: lng
        type: f4 # float 4 bytes
        doc: Longitude in microdegrees
      - id: alt
        type: f4 # float 4 bytes
        doc: Altitude in meters

seq:
  - id: gps
    type: gps_type # 12 bytes total
    doc: GPS data structure (latitude, longitude, altitude)

  - id: temperature
    type: s1 # signed int 1 byte
    doc: Temperature in Celsius

  - id: humidity
    type: u1 # unsigned int 1 byte
    doc: Humidity percentage

  - id: int1
    type: s2 # signed int 2 bytes
    doc: Custom integer field

  - id: int2
    type: s2 # signed int 2 bytes
    doc: Custom integer field

  - id: int3
    type: s2 # signed int 2 bytes
    doc: Custom integer field

  - id: int4
    type: s2 # signed int 2 bytes
    doc: Custom integer field

  - id: bool1
    type: b1 # boolean 1 bit
    doc: Custom boolean field (0 = false, 1 = true)

  - id: bool2
    type: b1 # boolean 1 bit
    doc: Custom boolean field (0 = false, 1 = true)

  - id: bool3
    type: b1 # boolean 1 bit
    doc: Custom boolean field (0 = false, 1 = true)

  - id: bool4
    type: b1 # boolean 1 bit
    doc: Custom boolean field (0 = false, 1 = true)
Encryption key
If your packets are encrypted, you must provide an encryption key. The system uses AES-128 to decrypt the received packets. The key must be entered as a 32-character hexadecimal value (16 bytes).
If no encryption key is provided, the packet will be assumed to be unencrypted.
2. Visualize your IoT data
After configuring your Kaitai parser and receiving the first packet, IoT data visualization will become available. You can select the time range and filter the data by date range and device.
Packets are only parsed and stored after a Kaitai parser has been properly configured.
If there is a mismatch between the IoT packet encoding/encryption and the Kaitai configuration, incorrect data may be stored and displayed in the dashboard.
Dashboard overview
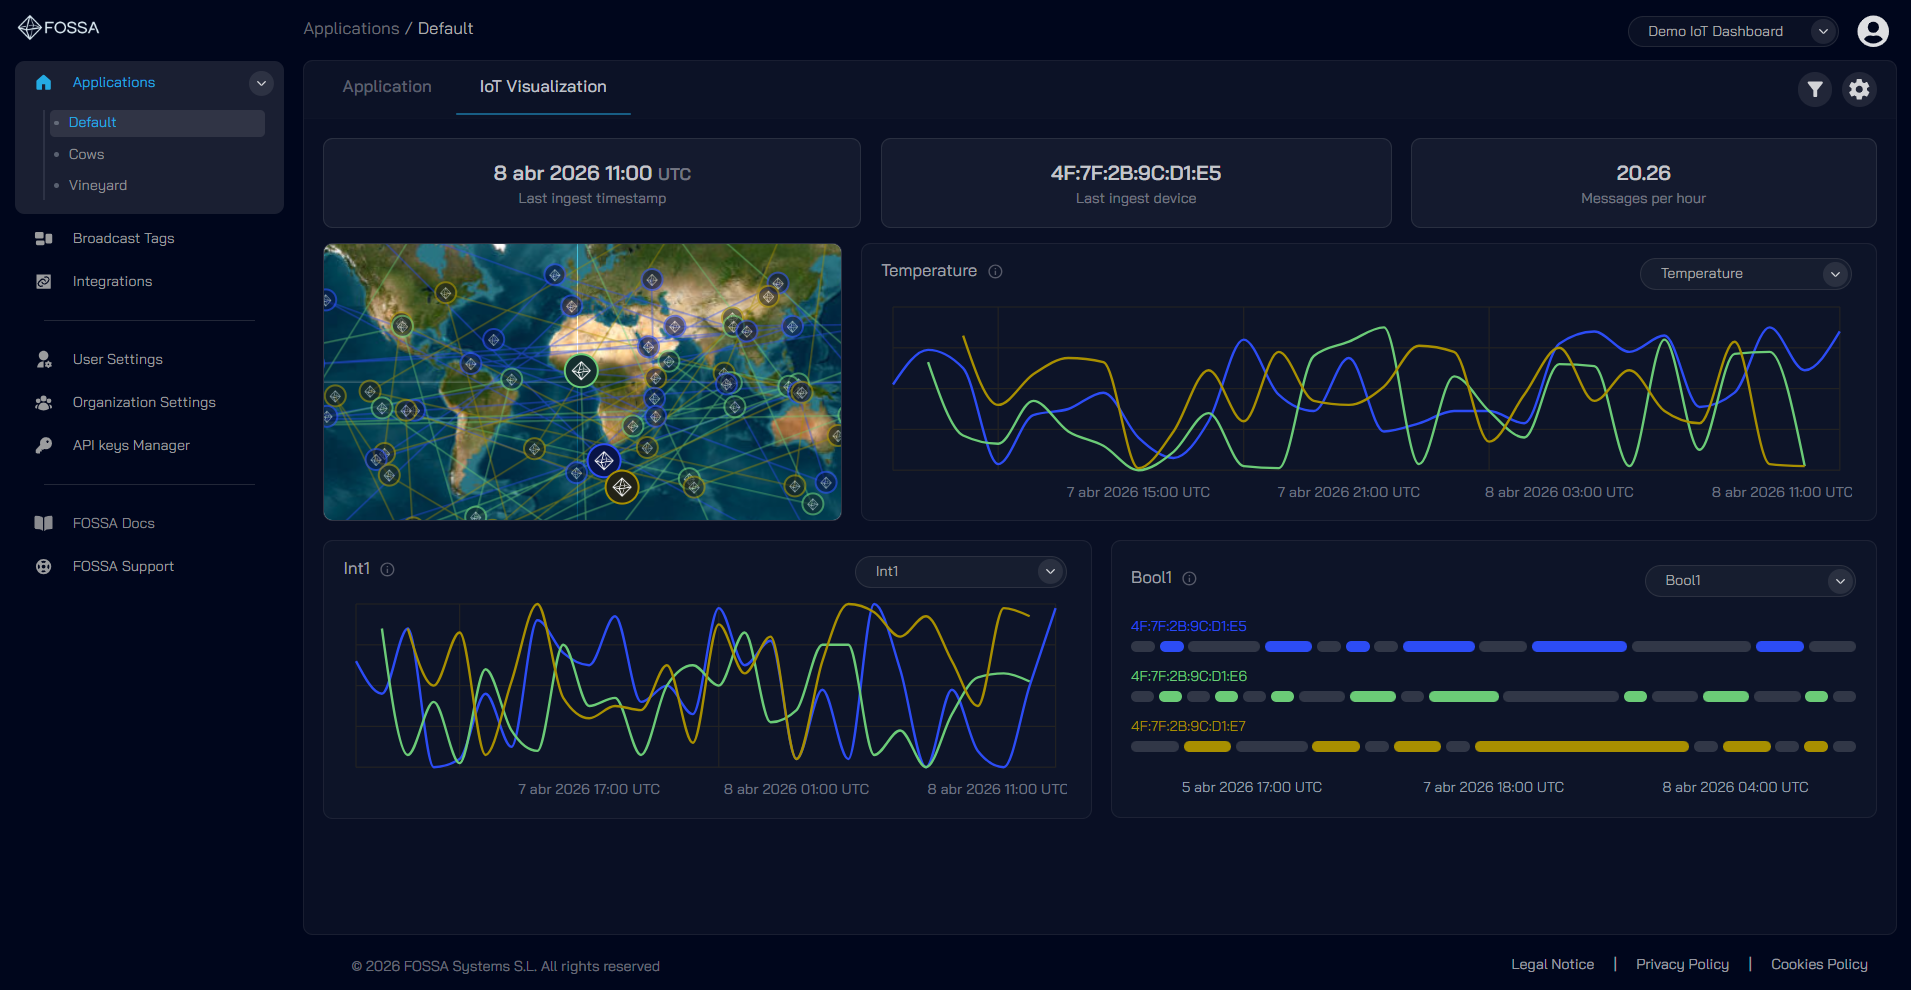
At the top of the dashboard, you will find a summary section with key metrics.
Below it, the dashboard is organized into four main visualization areas:
- Map view (GPS data): Displays the location data from the gps field.
- Temperature & humidity charts:Displayed as separate time-series charts.
- Integer charts (int1–int4): Displayed as separate time-series charts.
- Boolean charts (bool1–bool4): Displayed as on/off state indicators.
To switch the displayed field in any chart, use the dropdown selector and choose the desired field.
If a field is not defined in your Kaitai configuration, the dashboard will display a message indicating that no data is available for that field.
Dashboard filters
Filters can be applied by clicking the filter icon in the top-right corner of the dashboard.
You can configure:
- Time range: Select a custom period or use predefined ranges. By default, the dashboard shows the last 3 days.
- Devices: Select which devices to display. A maximum of 3 devices can be selected simultaneously to ensure readability. By default, the dashboard shows the 3 devices with the most recent activity.
- Step: Defines the interval at which data points are displayed.